


This is the final of four WBBA II Data Entry Tutorials. If you missed our others, please check out our tutorials on:
101: Entering a single incidental observation
201: Entering complete checklists
301: Understanding breeding codes and timing
Here we will focus on location precision. Our main messages are:
- Rather than reporting everything from your block at a single location, make a number of sub-locations within your block representing different regions, especially properties, habitat types, or counties when it’s feasible.
- Aim to make your checklists less than 5 miles. This ensures that the birds you observed are relatively close to the point at which you plotted them.
Why are we doing this?
WBBA I reported data like this, where all birds were reported at the block level. In eBird, all WBBA I data appears at the center point of the block. Here’s a Yellow-headed Blackbird record from WBBA I:

But what if we are interested in learning more about those Yellow-headed Blackbirds, to study or protect the nesting site? In this case, we don’t know where it was. In this particular instance, we don’t even know if the Yellow-headed Blackbirds within this block nested in Clark, Taylor, or Marathon county!
It would be much more informative, if there is a marsh in your block, to use a separate location for it.

This is a lot like how locations and hotspots are parsed out in general eBird — you’re just thinking about making points for locations you visit again and again — but in this case, you’re thinking about dividing up your own block into discrete units you will likely visit repeatedly.
Special reminder: PLEASE BE CAREFUL WHEN USING EXISTING HOTSPOTS AS ATLAS LOCATIONS BECAUSE SOMETIMES HOTSPOTS CROSS BLOCK LINES. In the above example, assuming you did not bird the extreme western edge of Schoeneberg Marsh, it’s fine to use that existing hotspot for birds you’re atlasing in that block. But before you select a hotspot, you must check where block lines fall! Block lines are pesky, and often cut right through existing hotspots. Always use the “Find it on a Map” option when plotting your location to pull up the atlas block grid and check where current hotspots fall to make sure your bird sightings are going into the correct block. Selecting the “Horicon Marsh NWR — General” hotspot will likely not get your birds plotted anywhere near where you saw them!
When locations are plotted with greater precision, the information becomes much more valuable for data users, such as land managers and scientists. The Wisconsin Department of Natural Resources is very interested in getting inventories of the birds on their properties. For this reason, if you have a State Natural Area or State Wildlife Area within your block, please keep separate lists of the birds on those properties. Scientists are often looking to use eBird data to make predictions about landscape-level bird use. If your Wood Thrush plots out in farmland instead of forest, this could reduce the accuracy and usefulness of these models.
Wisconsin Society for Ornithology’s seasonal summaries in the Passenger Pigeon have reported birds by county for decade. Making sure your birds are plotting out to the right county can assist them in keeping consistent bird records. eBird also aggregates data by county in several places, including the general Explore Data tools, county summaries for the Atlas, and also on your personal lists on the My eBird tab.
So how should you break up your block? Obviously we’re looking to strike a balance between providing locations that are useful, yet keeping your data entry manageable. It will likely vary by block, based on the habitat types, properties, and access within a block, and different people might do it in different ways.
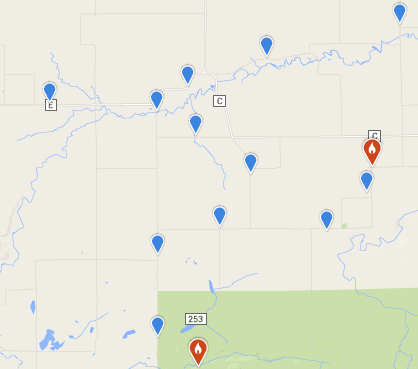
Here’s one way you might divide up points. Notice some of these sub-locations are based on ownership type, others are based on habitat type, and others are just a general midpoint of a road or a large forested area.

If you’re curious, you can’t find the above map in a single location. This is an overlay of eBird-style location points on top a view you can find on our Atlas Interactive Map.
If you have a fairly uniform block with regard to both habitats and properties, you might use fewer points. You could just divide your block up into 4 quarters, or select major roads as center points for your routes. Here’s an example of a block with two ownerships, relatively similar habitat, and only a few roads:

To assist you as you explore your blocks and figure out where to go and how to divide those checklists, we have a wealth of tools on the atlas website.
The simplest are the Static Maps, available with either Aerial Photo or Topographic Backgrounds, these identify your block boundaries, roads, and ownerships.
We encourage you to explore the Interactive maps. These are powerful tools for exploring ownerships, Managed Forest Law properties, habitat types, and much more. You can print custom maps with any layers you choose at any scale you choose, or you can just print out a static map and use the interactive map to zoom in and out and explore various areas. The interactive map also works on your smartphone or other mobile device (assuming you have a signal).
We have created a Tutorial to the Interactive Maps that should help get you started if you need assistance.
We also like Bing Maps, which oftentimes has very high quality Birds Eye aerial imagery that lets you get a zoomed in view of the habitats in your block.
For advanced users, we also have the atlas blocks available as a shapefile, and a kmz file for use with Google Earth.
If you’ve made it through all 4 tutorials, and have read the Atlas Handbook, congrats, now you’re an atlas pro — go forth and find some birds!